Description
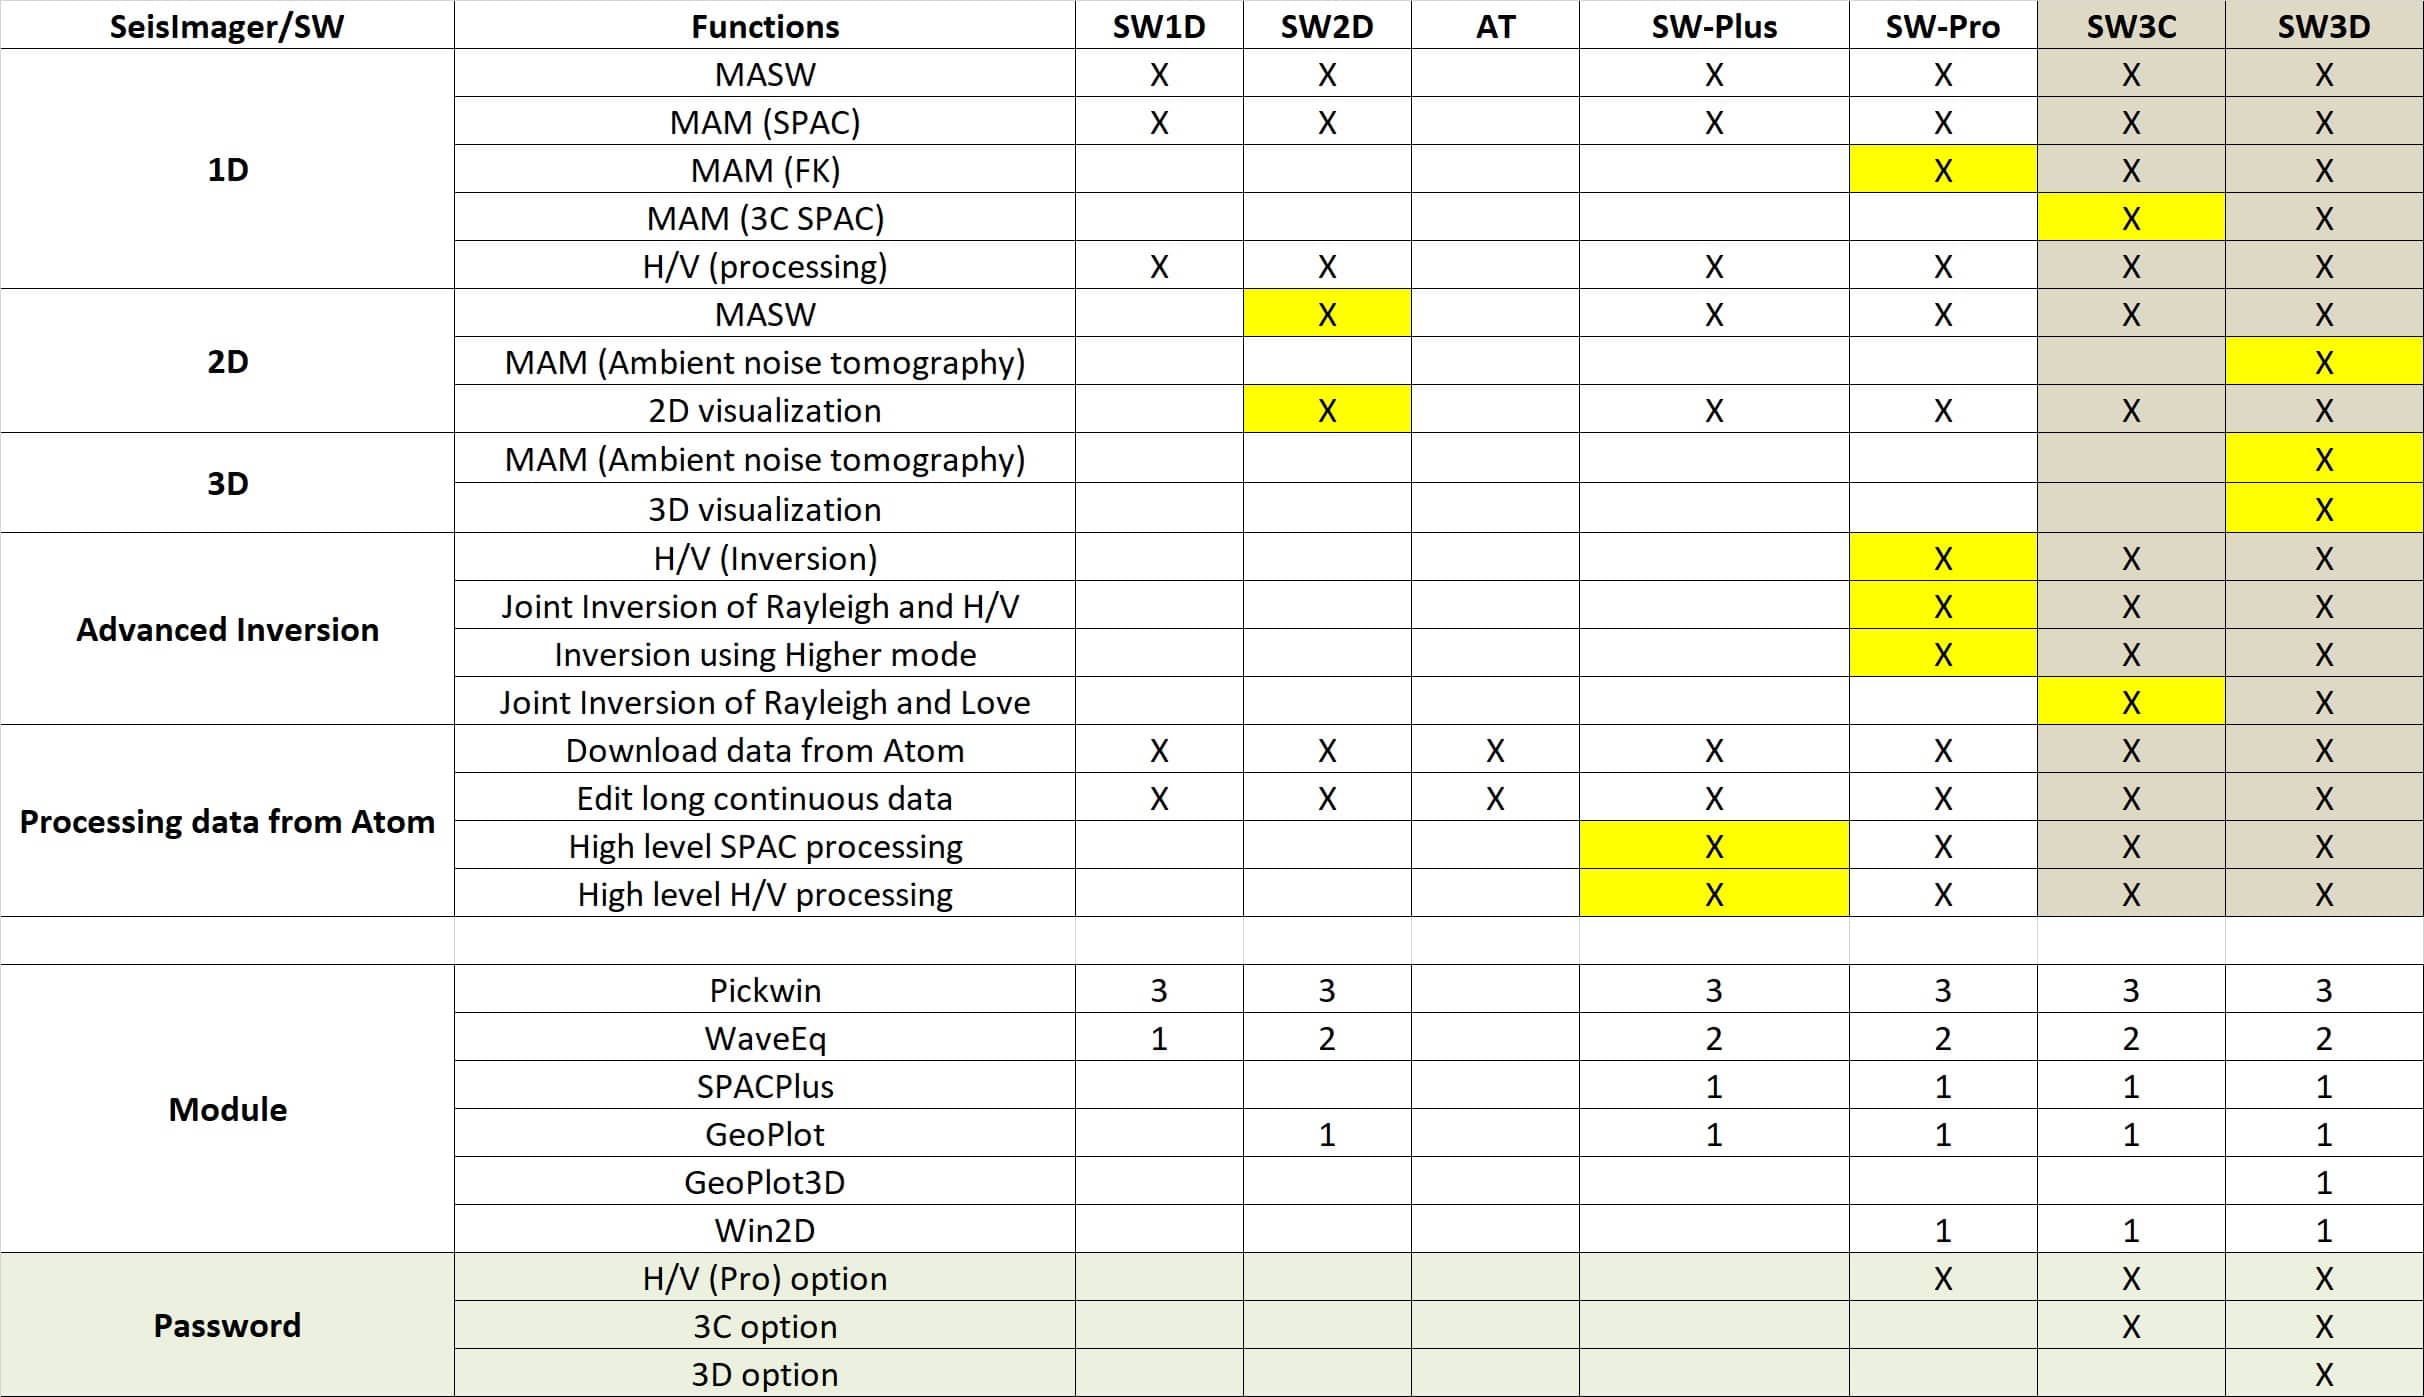
Surface waves are easy to record and loaded with information about the subsurface. With SeisImager/SW, data processing is simple, putting the answers you seek at your fingertips. SeisImager/SW includes both active source and passive source data analysis capability. The higher frequency data from a sledgehammer source that travels through shallower depths can be combined with lower frequency data from microtremors that travel through greater depths. Combine the results for one high-resolution plot of S-wave velocity. Upon launching the software, a wizard walks you through the data analysis. SeisImager/SW includes default parameters that are suitable for most cases, but are fully user-adjustable as needed. In addition to the main functions used to determine Vs, SeisImager/SW also allows the user to build models and examine the effects of velocity variations. Borehole data such as P-wave velocities and blow counts (N-values) can also be correlated.
SeisImager/SW Software Packages
Demonstration version: for use on Windows PC with mouse, may be launched 15 times, capable of 1D active source Multi-channel Analysis of Surface Waves (MASW).
SeisImager/SW Data Processing Resources
3-Component SPAC processing using SeisImager/SW-3C
Atom Seismograph AVS30 MASW Guide
3D Ambient Noise Passive-Seismic processing using SeisImagerSW SPAC+
Atom Seismograph and SeisImager/SW Data Processing YouTube Playlist
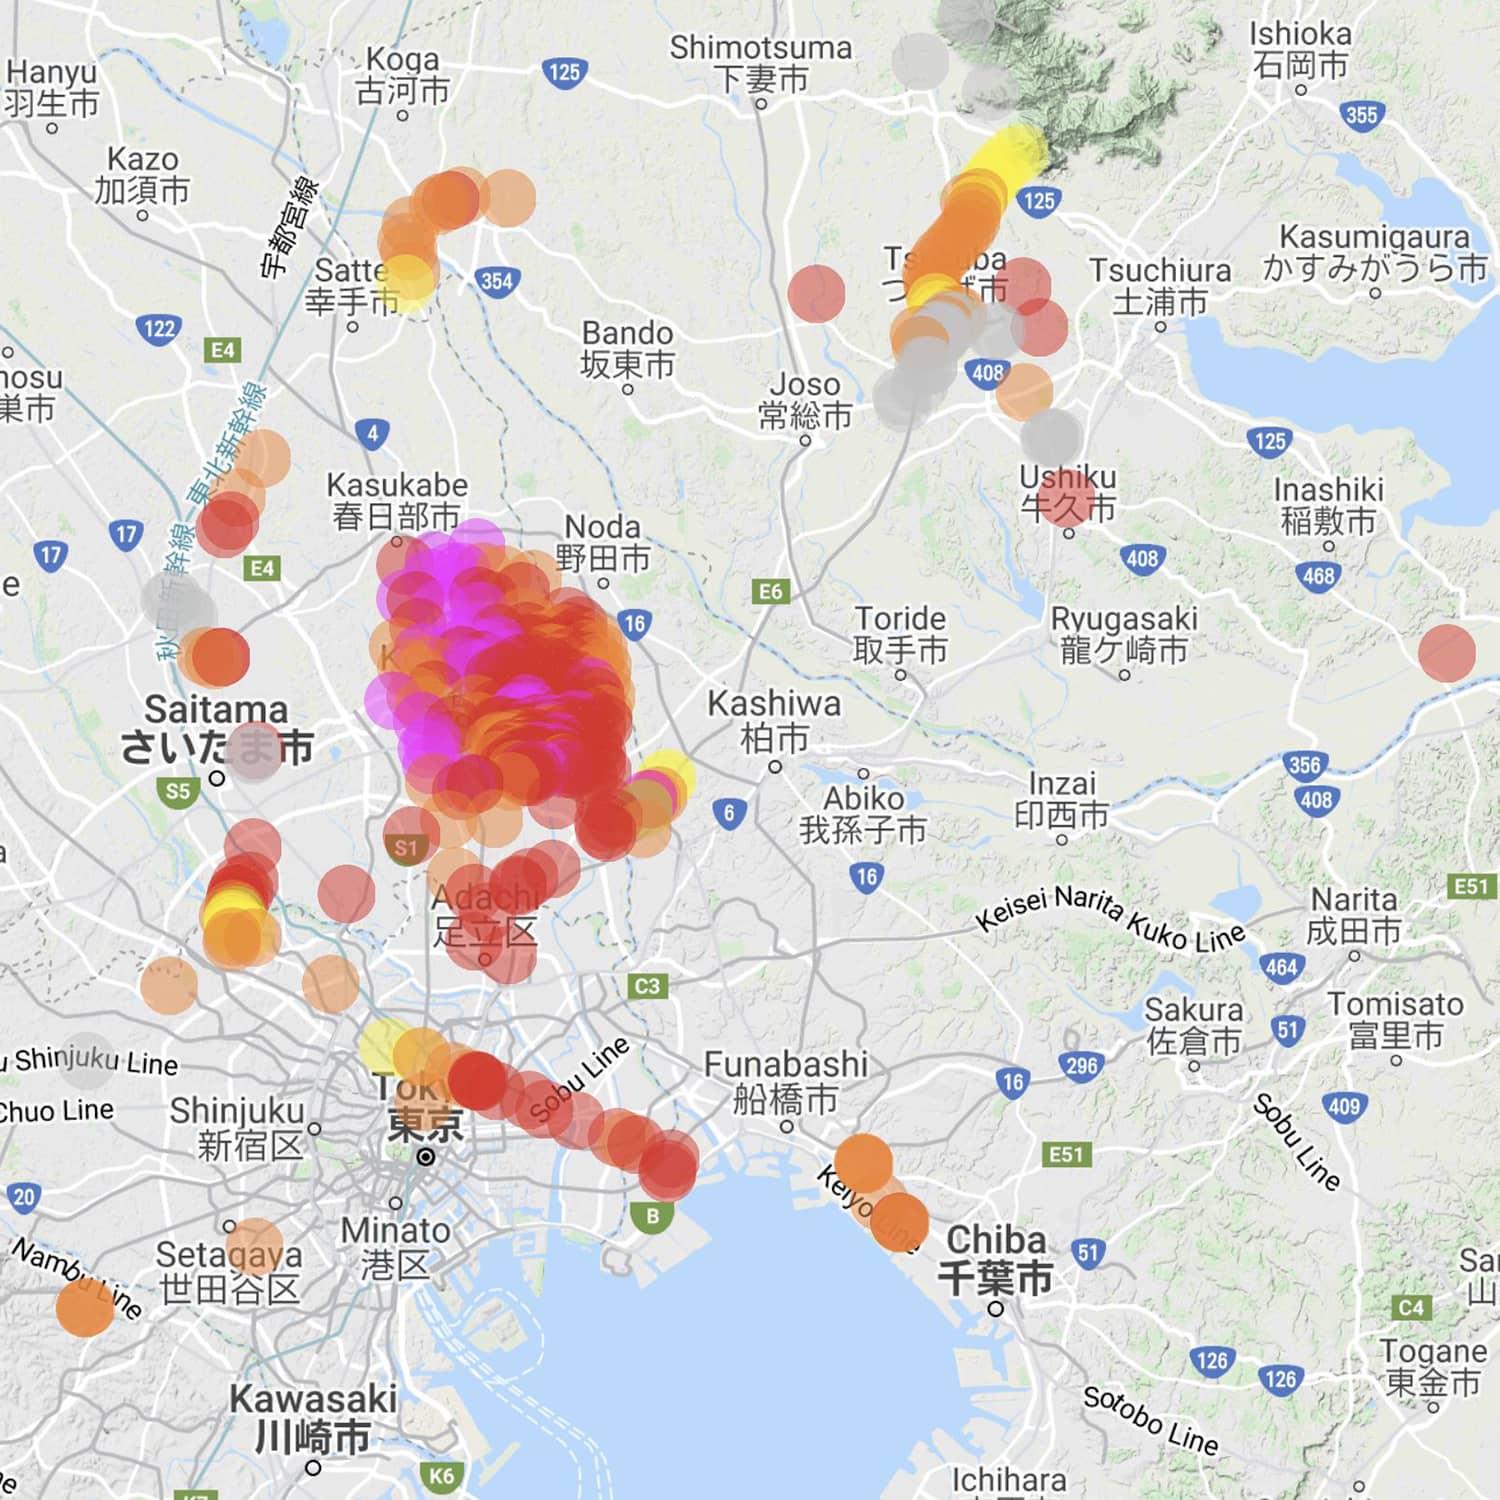
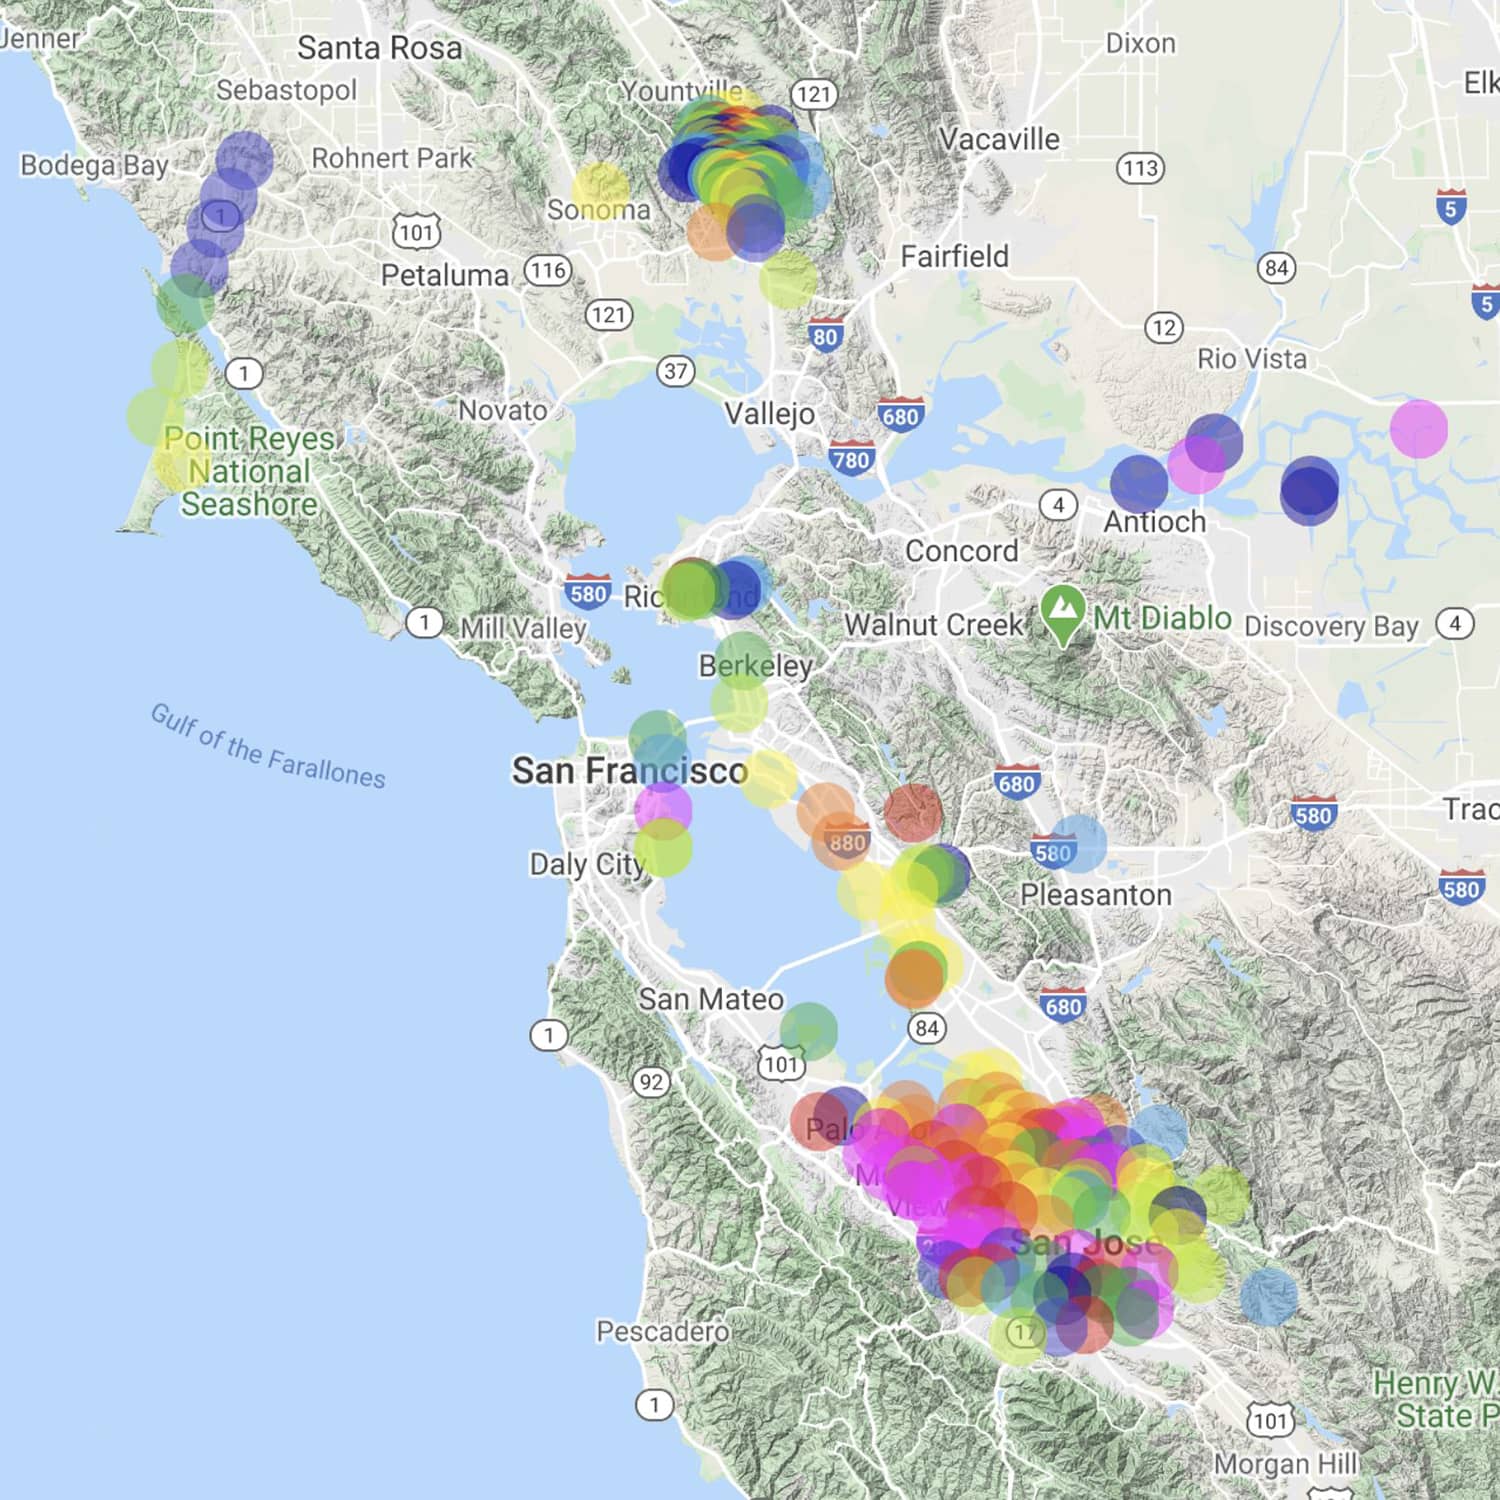
SeisImager AVS30 and H/V Maps
powered by seisimager.comFeatures and benefits
- Calculates phase velocity and automatically picks dispersion curve
- Performs inversion to iteratively seek 1D S-wave velocity (Vs) curve or 2D Vs cross-section
- Allows active and passive source dispersion curves to be combined for a high-resolution result over all depths sampled
- Flexible geometry options suit a wide range of site configurations and conditions
- Analysis based on robust methods: frequency domain tau-p, CMP cross-correlation for active source Multi-channel Analysis of Surface Waves (MASW); Spatial Autocorrelation (SPAC) for passive source Microtremor Array Measurements (MAM)
- Includes editing and QC functions, and velocity modeling


